- NBR Project Series 656 Harvest and Storage Risk, Work Package 1.
- This project is financed by NBR, with support from Partnerskap Alnarp.
- Team: William English (NBR) and Prof. Kristina Blennow (SLU)
The primary goal of this Work Package is to model the climate related harvest and storage risk for the Swedish sugar beet industry. That is, for any given year, what is the probability that it will be either too wet or too cold to harvest the crop, or too cold to store the crop without damange? The modelling exercise will focus on multiple areas within the growing region, and use both historical data and climate scenarios.
The overall modelling approach adopted is that presented by The Inter-American Development Bank (IDB, A.K.A. Banco Interamericano de Desarrollo (BID)) in their course Natural Disaster and Climate Change Risk Assessment Specialization on Coursera. The first thing I noted when taking this course is that the definitions they use are the same as those used by the International Panel on Climate Change (IPCC) and The Food and Agriculture Organisation of the UN (FAO), among others. It was also evident that while the course focuses on infrastructure projects, the framework is universally applicable.
The course emphasises heavily the need for both qualitative and quantitative analysis of risk. In the qualitative step, the types of hazards and adverse effects that in play within the system are analysed. In the quantitative step, numbers are put to these.
QUANTITATIVE RISK MODEL STRUCTURE
GENERAL
The general framework for modelling risk, presented in it most simple form, is an Influence diagram. The general form is:

HARVEST AND FROST
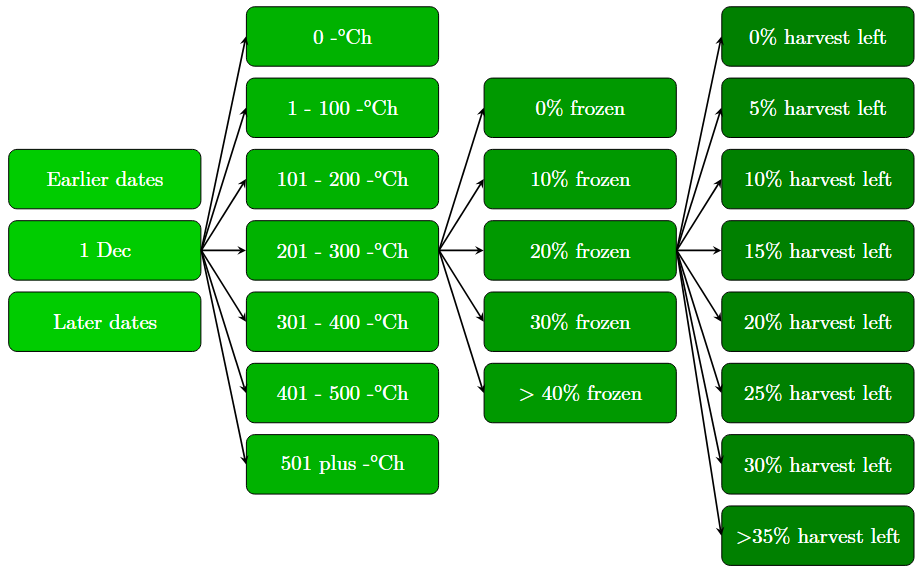
For the risk of frost during the harvest campaign:
Influence diagram

Event tree – events
The Event tree is just an expanded version of the influence diagram, showing the details of the model. Or, at least, some of the details. In all, there are 14 280 possible conditional events in this model. “Conditional” in that the probability of the Damages level occurring (eg when 0% harvest left) is specific to that level Adverse effect (eg 20% of roots left in the ground are frozen), which is turn is conditional on the probability of the Hazard event (eg an event of 201 – 300 cumulative degree-hours (temp x 1 hour) of negative degrees starting on this date), which in it’s turn is conditional on the date.

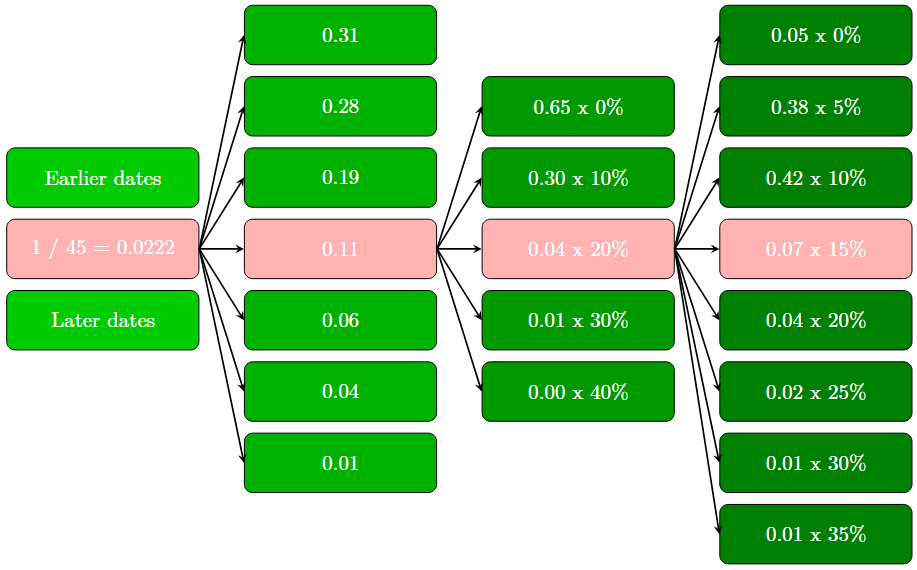
Event tree – probabilities and damages
This version (below) of the Event tree shows the probabilities at each level. For the event highlighted in red; the probability of the Hazard event is 0.0222 x 0.11 = 0.002444, the probability of damages is 0.04 x 0.07 = 0.000112, and size of the damages is 20% (0.20) of the crop frozen, with 15% (0.15) of the crop left to harvest. If we harvest 2 million tonnes of beets, at a price of 350 SEK / tonne, the total damages for this particular event is 0.0222 X 0.11 x 0.04 x 0.07 x 0.20 x 0.15 x 2 000 000 x 350 = 143,7 SEK. Not much. But when we do this for all 14 000 possible events, it will add up.

HARVEST AND MOISTURE
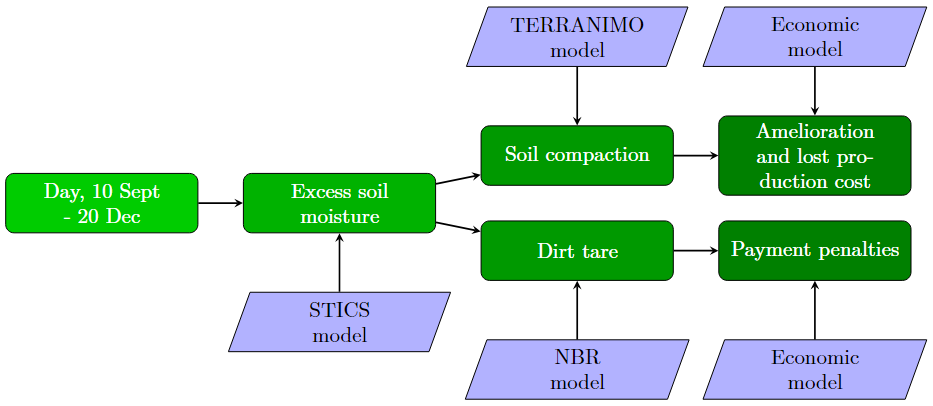
For the risk of excessive moisture during the harvest campaign:
Influence diagram

The modelling of harvest risk and moisture will draw directly from the work done in France on this question. This sees the STICS crop growth model used to model soil moisture, and the TERRANIMO model for soil compaction risk. For each soil moisture content profile, the TERRANIMO model will give an indication of a field’s trafficability. That is, can a harvest move over the field without causing extensive soil compaction? If time and resources permit, the extra layer of workability will be considered. That is, can the job of harvest be done properly?
STORAGE AND FROST
For the risk of frost during the storage campaign:
Influence diagram
